Analytics & Data Visualization
Transforming complex data into meaningful and actionable insights, facilitating informed decision-making, identifying trends, patterns, and opportunities, and enhancing overall data-driven strategies.
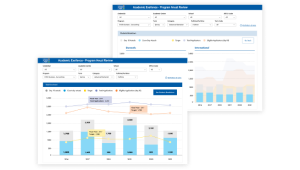
Unified Insights – A User Interface Perspective
Our expertise in UI design ensures a seamless user experience in navigating complex data landscapes. We bring together different systems, each with its unique data, and present it in one unified interface. The result is a visually intuitive, information-rich platform that empowers users to make data-driven decisions with ease.
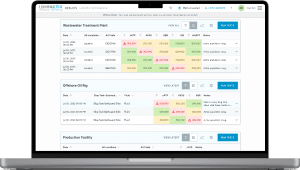
Data Ecosystem Integration
Our services seamlessly integrate with your existing data ecosystem, ensuring a harmonious flow of data between various systems. This convergence eliminates data silos, streamlines processes, and enhances the accuracy and timeliness of insights.
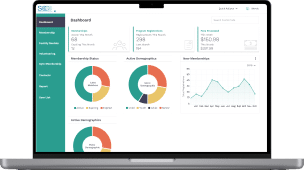
Visualizing Data for Impact
Data is only as valuable as its accessibility and comprehension. Our data visualization solutions translate raw data into insightful, interactive visual representations. This not only simplifies complex data but also empowers users to uncover patterns, trends, and opportunities that drive business growth.
In today’s dynamic business landscape, Analytics & Data Visualization are indispensable tools for staying competitive and agile. We offer the keys to unlock the full potential of your data and transform it into actionable insights.